
Swells
Scripps Swell Model
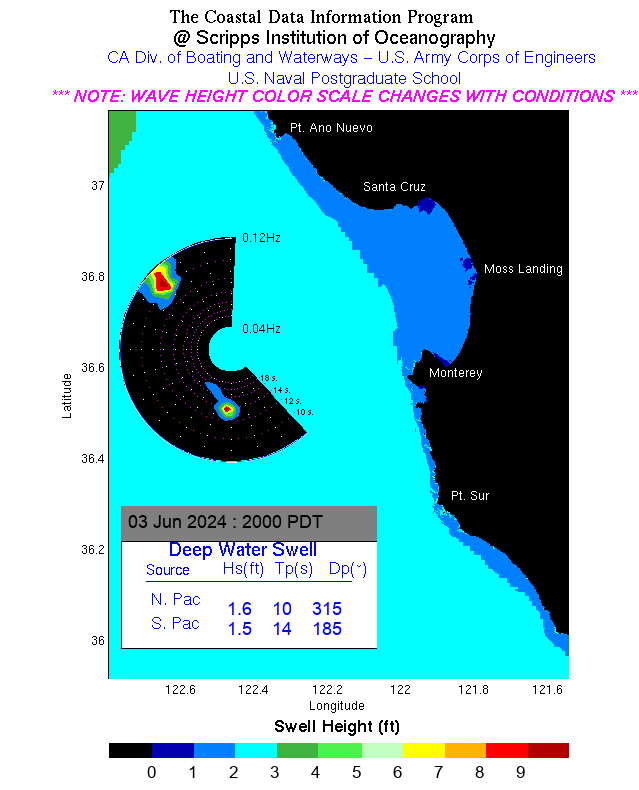
One of the easiest to interpret swell models is this model from Scripps Institution of Oceanography. The colors represent the difference in swell heights throughout Monterey Bay.
When reading this model consider the following:
- On most days small swells are in the blues, with high swells starting with the greens. However, depending on the swell range, the scale can change. So always confirm the current color scale.
- Monterey is usually sheltered from the primary swell. If you see large swells reaching into Monterey Peninsula, consider another day for diving.
- The model is updated regularly, often twice a day, but always verify the date.
Interactive Swell Forecast
Windy.com’s interactive weather map provides many models valuable to divers, including swells, waves, wind, and rain. You can toggle between these views by clicking the model selector in the upper-right corner.
The status bar at the bottom allows selection of different times throughout the day, and you can zoom and drag the map to get more detailed information about a specific area of Monterey Bay.
NOAA Swell Forecast
The charts below list NOAA’s forecasts for swells heights in Monterey, and indicate the primary swell height and direction based on measurements northwest of Point Pinos, which is the northern tip of the Monterey Penninsula. Data is updated hourly.